Monitoring and analyzing log data efficiently is important. It ensures smooth operations and helps identify potential issues promptly. But log management can quickly become a challenging puzzle since logs are scattered across various systems, applications, and services, requiring Devs and Ops to navigate through different platforms and interfaces.
This is where Grafana Loki, an open-source and powerful log aggregation system, comes into play. And, by pairing Loki with Facets, an infrastructure management platform, you can unlock a wealth of benefits that revolutionize the way logs are managed.
In this blog, we will explore the features and advantages of this powerful integration, shedding light on how Facets simplifies log management.
Understanding Grafana Loki
Grafana Loki is a robust log aggregation system built to streamline log management across multiple sources. It centralizes logs from diverse components, such as applications, databases, proxies, and more, within a unified dashboard. This setup makes it much simpler to analyze logs without the hassle of jumping between different logging systems.
However, using Loki isn't a walk in the park.
Setting up and getting Grafana Loki just right can be a bit of a difficult task, especially if you're not well-versed in the world of log aggregation and distributed systems. And if Loki or the broader Grafana environment is new to you, brace yourself for a steep learning curve.
Mitigate all complexity with Facets
However, with Facets, you can reap all the benefits of Loki while making it extremely simple to use
All log data without losing context
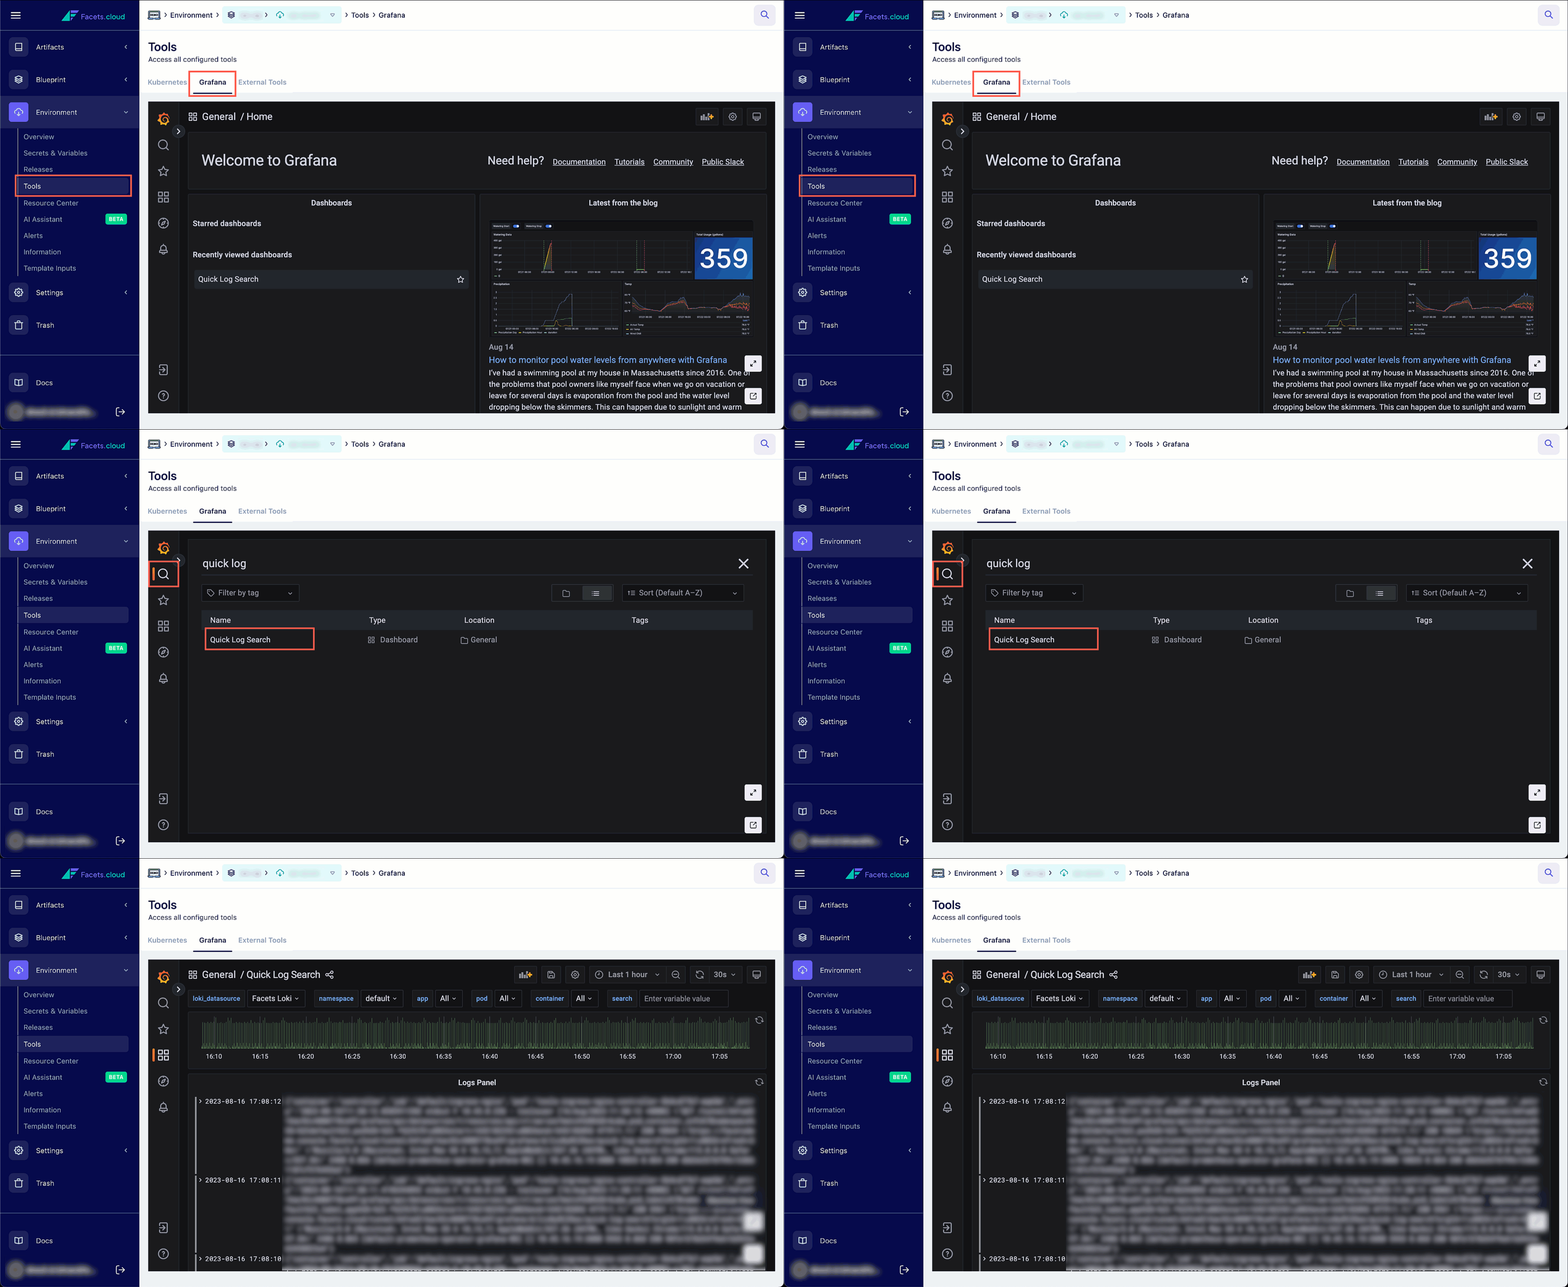
Facets provides an intuitive and user-friendly interface so that you can view all your application log data right where you need it, just with a single click. This unified view allows both developers and operations teams to gain comprehensive insights without the hassle of jumping between different tools and losing context.
Out-of-the-box setup
Integrating Loki with Facets means you have zero setup overhead. The pre-configured solution allows users to dive straight into log analysis without having to spend any time or effort on setting up multiple tools.

Easy Log filtering
One of the standout features of Facets is its intuitive search and navigation capabilities. Traditional log analysis tools often require complex queries and commands to retrieve specific data. Facets creates a set of predefined filters that speeds up the troubleshooting process.
Alerting and troubleshooting made simpler
Facets takes log management to a whole new level by seamlessly integrating with open-source tools like Alertmanager to provide proactive alerts and notifications. And, with its AI-powered chatbot, Facets explains the nature of the issue and suggests potential solutions to any log errors.
This dynamic combination of proactive notifications and AI-driven insights transforms log management from a reactive process to a proactive, solution-driven approach, empowering both developers and operations teams to mitigate issues swiftly and with a deep understanding of the problem at hand.
Wrapping Up
The integration of Grafana Loki with Facets brings unparalleled power and simplicity to log analysis and management. By harnessing the strengths of these two robust tools, organizations can extract valuable insights from their log data, make data-driven decisions, and ensure optimal performance and reliability of their systems.
Whether in cloud-native environments or traditional setups, this integration is a game-changer. Embrace the power of Grafana Loki and Facets today and embark on a journey of enhanced log visibility and streamlined troubleshooting.


